When polls shape opinion rather than measure it

From what I can tell, pollsters are generally fairly stick-to-the-facts folks. They deal in facts and statistics. But there’s something important to remember. They have clients. Their clients are often news organizations. These news organizations, not polling experts, are the ones that come up with their own takeaways, headlines, analyses and context — or lack thereof — for the polls they commission. And, as we have seen, they may have their own idea of how they want things to come out.
That’s where I think polls have now become thought of as tools to shape opinion, rather than to measure it.
While looking into this phenomenon in 2016, I contacted a number of polling groups. I knew that they “weight” and adjust their samples to make them reflect certain demographics of the U.S. population. In simple terms, if their sample ends up with too many young people, they assign greater weight to responses from older people. The methods they use to do so vary and are arcane, to say the least. For example, ABC states that it “adopted iterative weighting, also known as raking or rim weighting, in which the sample is weighted sequentially to Census targets one variable at a time, continuing until the optimum distribution is achieved.”
But one of the most interesting things I learned had to do with one big factor for which they typically don’t “weight” or adjust. It’s one that I think is arguably among the most important when it comes to polls measuring political issues: political affiliation. In other words, the national pollsters I spoke with told me that if they end up interviewing significantly more Democrats than Republicans — which is often the case — they don’t necessarily adjust the results to try to make the sample reflective of the U.S. voting population.
The pollsters gave me several reasons for this. Political affiliation, they say, is a moving target for many people. Also, they ask, what standard would they use to weight the results? Would they try to create the same proportion of Democrats and Republicans as reflected in the last census? The last election? Would they aim for the sample to roughly look like the ratios of Democrats and Republicans who actually turned out to vote in the 2016 presidential election?
But the questions raise an important point, I think. If political affiliation isn’t weighted, and if samples are politically lopsided, shouldn’t that fact be disclosed for context in the resulting news stories? And if political affiliation is weighted, shouldn’t that process be described?
For example, if it’s reported that a poll shows 55 percent oppose President Trump, that implies one thing. But what if you were to learn the sample included 60 percent Democrats? Suddenly, in context, the same results look brighter for Trump.
Such was the case when I dug into a recent Washington Post-ABC News poll that measured Trump at 53 percent disapproval; according to the poll, 46 percent of registered voters said there is no chance they would consider voting for Trump over any Democratic candidate.
But I found some interesting nuggets that went unreported.
As usual, the sample was Democrat-heavy: 29 percent of respondents who gave their affiliation were Democrat, compared to 23 percent Republican and 37 percent independent. Despite that, more registered voters — 49 percent — said they would choose Trump over a Democrat whom they regard as a socialist (43 percent); 8 percent said they had “no opinion.”
In other words, put into context, among the Democrat-heavy sample, Trump beat out a socialist-style Democrat.
On another topic, I found a bit more news than most headlines reflected. Again, among the Democrat-heavy sample, 59 percent said Congress should not begin impeachment proceedings against President Trump; 37 percent supported the start of impeachment proceedings. In other words, put into context, Republicans made up 23 percent of the polling sample but more than two and a half times that number — 59 percent — do not favor impeachment proceedings against President Trump.
If this poll did adjust or weight its sample based on political affiliation, it is not described specifically in the results, making it impossible for an average consumer to interpret whether the findings ultimately reflect positively or negatively on a particular political candidate in the big picture.
These are just two examples of context that could make poll results looks a lot different than the headlines. Naturally, it’s also possible for reporting on poll results to be skewed to favor Trump. And it’s theoretically possible for polls to interview significantly more Republicans instead of Democrats — though all of the polls I happened to examine counted more Democrats.
The bottom line is: Polls can be provocative, informative, fun or maddening. But as we move into 2020, it’s important to be mindful that news organizations or those interpreting their polling results may not always be providing context that would allow us to have the most complete and accurate picture of the public’s mood at a given moment.
Sometimes they’re trying to influence rather than inform.
Sharyl Attkisson (@SharylAttkisson) is an Emmy Award-winning investigative journalist, author of The New York Times best-sellers “The Smear” and “Stonewalled,” and host of Sinclair’s Sunday TV program, “Full Measure.”
Copyright 2024 Nexstar Media Inc. All rights reserved. This material may not be published, broadcast, rewritten, or redistributed..
More Campaign News


tt
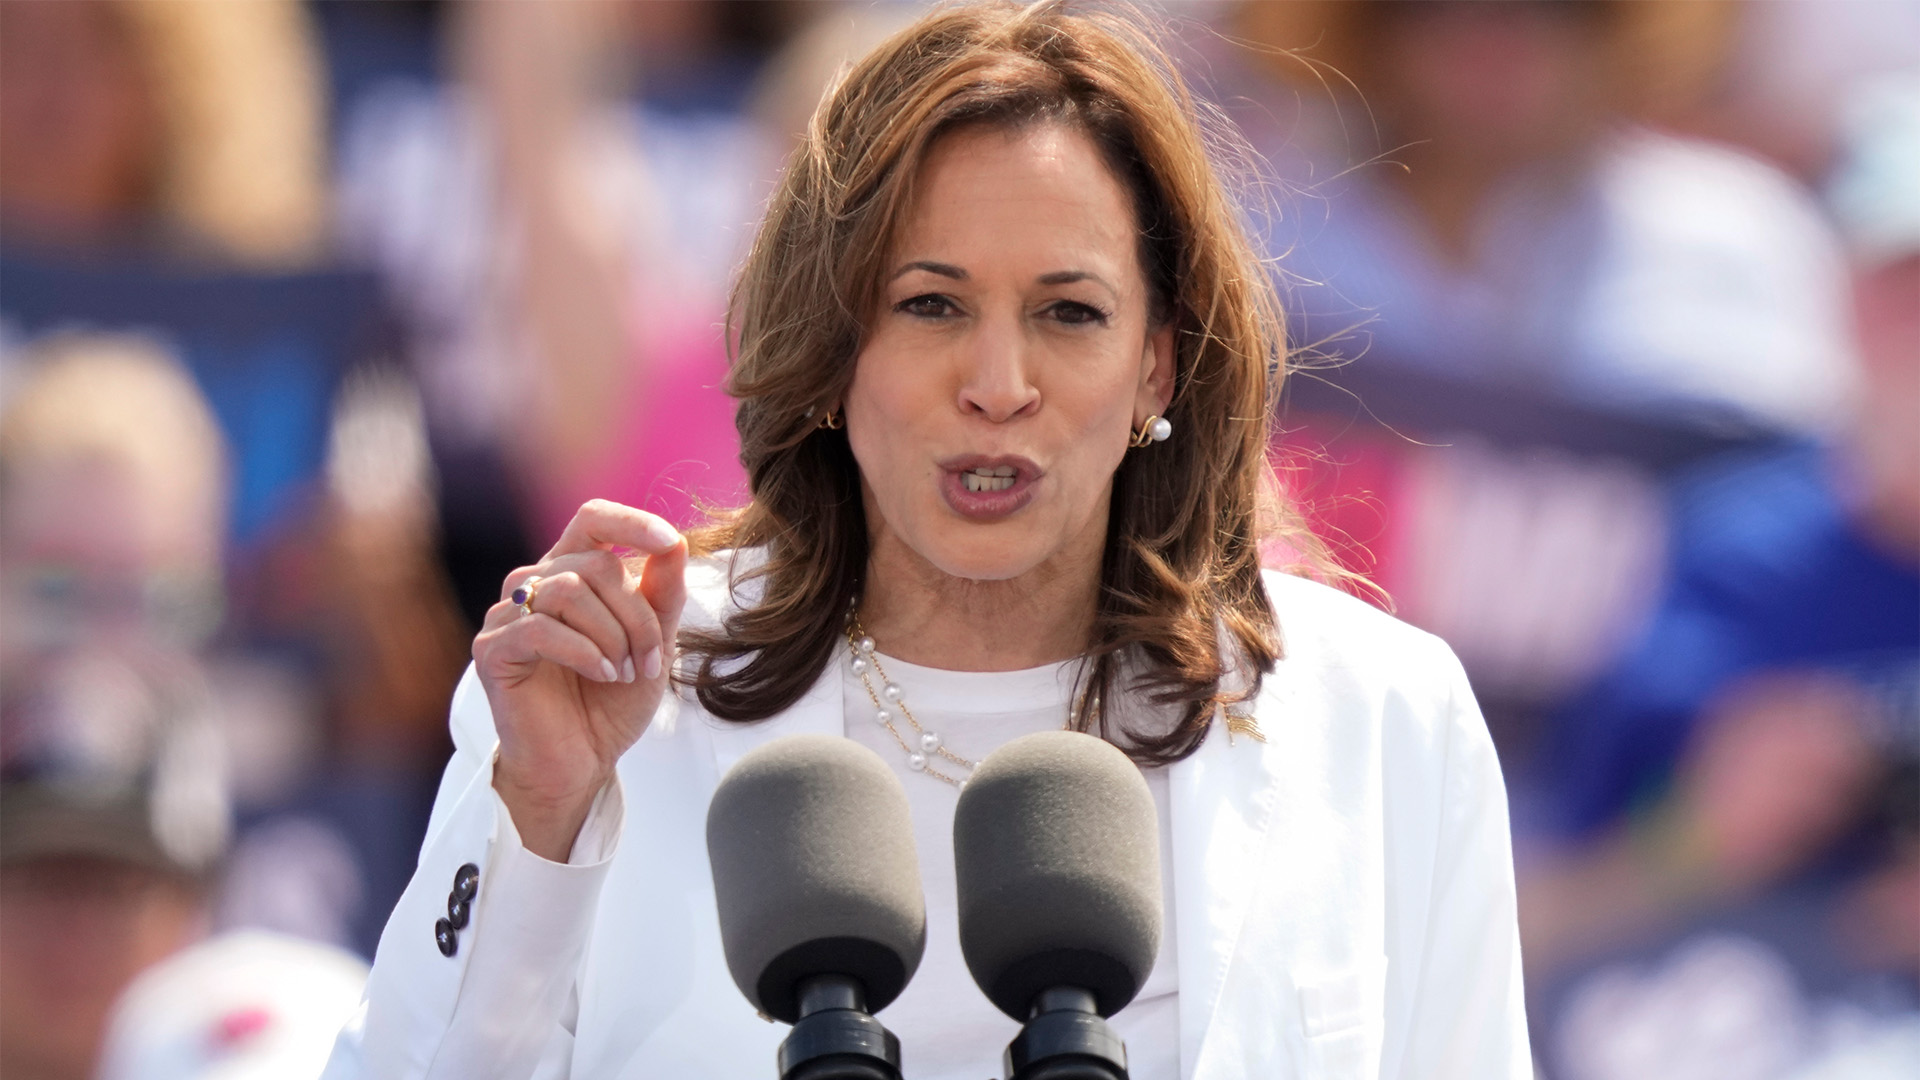
Harris calls for ending filibuster for abortion rights